Building an automated Power BI intelligence dashboard for a restaurant chain
Client
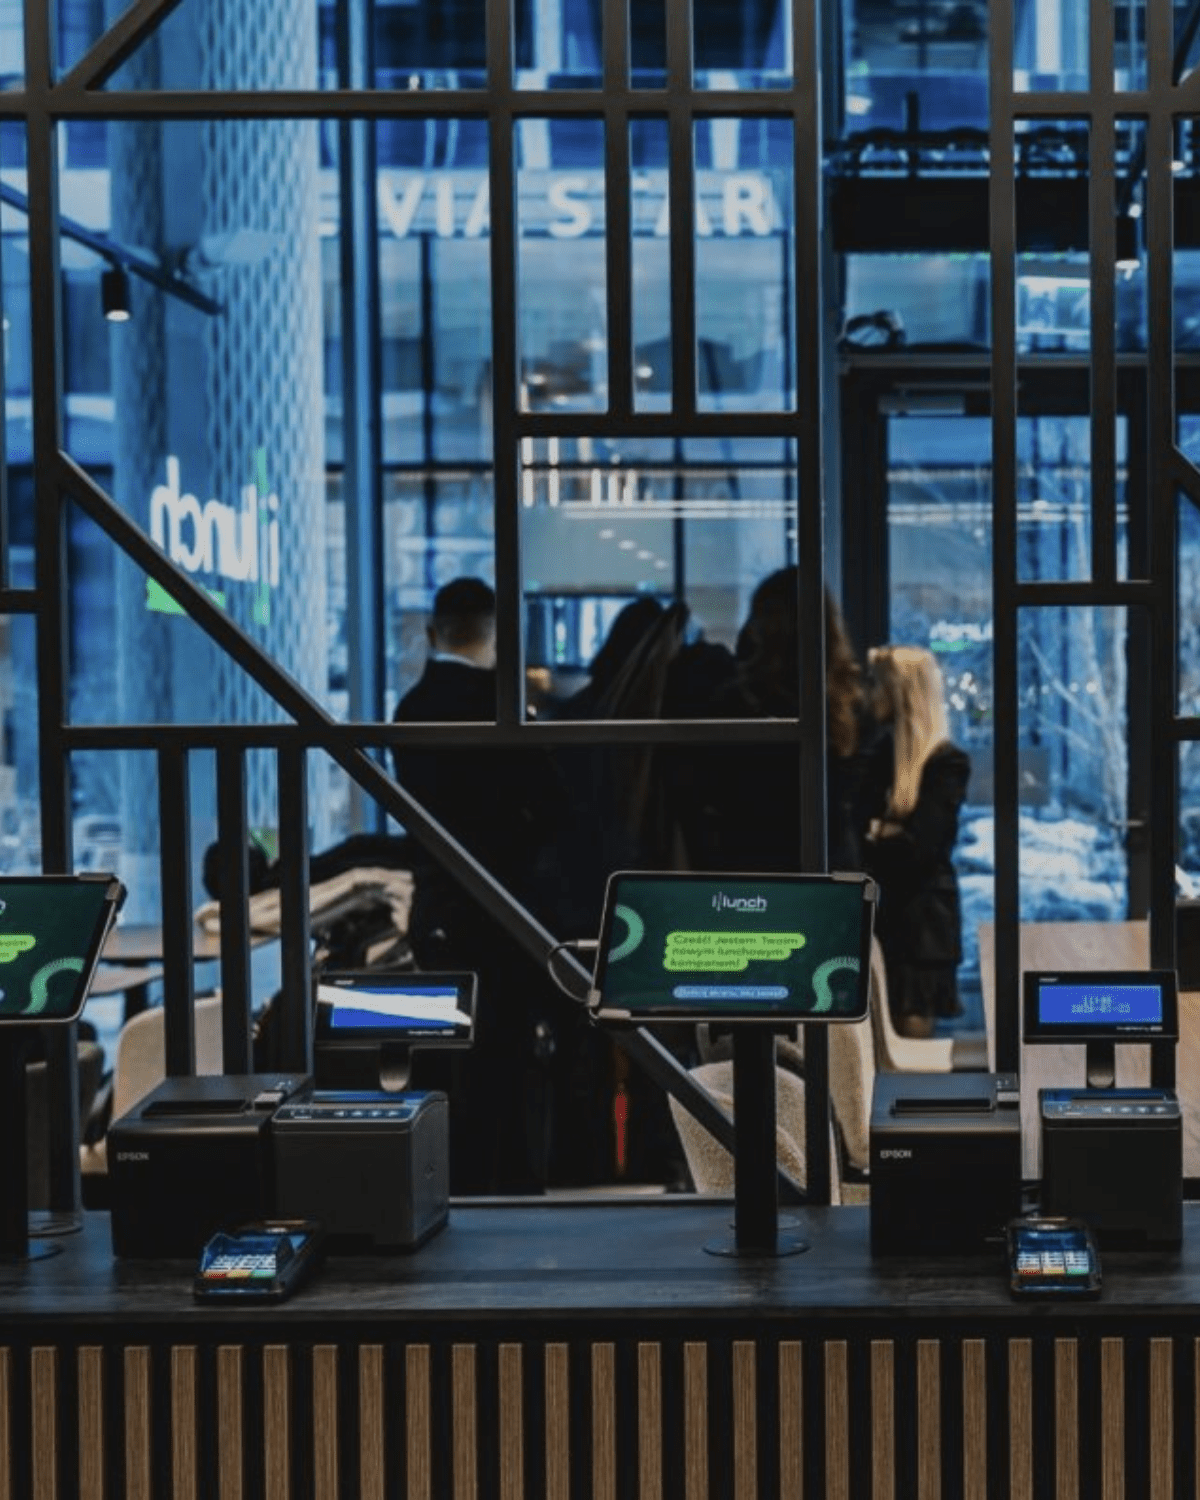
iLunchClient Overview:
Founded in 2016, iLunch is a Lithuanian smart restaurant chain operating around 45 locations across Lithuania, Latvia, Poland, and the UAE. The company specializes in a high-efficiency lunch model that uses self-service technology and a daily rotating menu to serve freshly prepared hot meals in under two minutes, primarily catering to the fast-paced needs of business centers and urban professionals.
The Challenge:
iLunch was dealing with highly fragmented data spread across multiple operational systems and external platforms. With critical business information scattered across point-of-sale (POS) systems, enterprise resource planning (ERP) software, and various disconnected spreadsheets, tracking performance had become a heavily manual and time-consuming process. Relying on a multitude of static Excel files to stitch this data together was no longer efficient or sustainable for a rapidly expanding business.
The objective was to eliminate manual data collection by building a centralized, automated analytics architecture. iLunch needed a data engineering solution that could consolidate these disparate data sources into a single, reliable data warehouse, ultimately powering a comprehensive suite of Business Intelligence (BI) dashboards. By implementing reporting automation, the goal was to make reporting faster, more efficient, and highly reliable, allowing the management team to monitor everything from high-level financials to granular operational analytics without the burden of repetitive manual work.

Our Approach:
- Phase I: Data pipelines and API integration
We began by establishing a robust, automated data extraction process. Instead of relying on manual exports, we built custom data pipelines and set up API connections to pull live data from iLunch’s ERP, POS, and external systems. Simultaneously, we integrated various flat data sources, including a variety of Excel files and operational reports, through automated SharePoint workflows.
This initial stage created a fully hands-off foundation for reliable data movement. It ensured that the reporting environment would no longer be bottlenecked by manual downloads, and it established a highly scalable framework that can easily accommodate data from new restaurant locations as the chain continues to expand.
- Phase II: ETL processing and data integration
To handle the complex variety of incoming data, we deployed KNIME to manage the Extract, Transform, Load (ETL) processes. This data integration phase allowed us to clean, standardize, and merge the fragmented data streams before securely storing them in a centralized Microsoft SQL database.
The data model was designed with long-term extensibility in mind. This means the client received a flexible data warehouse structure that can seamlessly integrate new software systems, external data sources, or advanced metrics in the future without requiring a costly redesign of the underlying logic.
- Phase III: Sales dashboard development
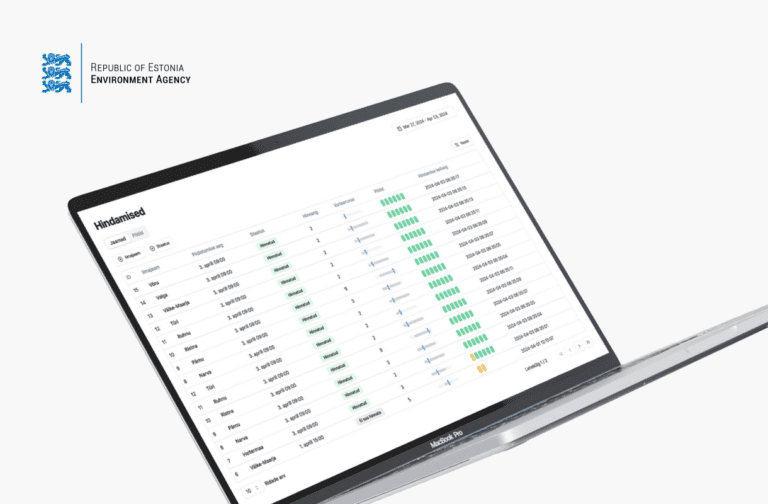
With data centralized, we utilized our expertise in data visualization to develop a diverse suite of targeted Power BI dashboards tailored to specific business cases. The reporting scope covered KPI analysis, overall sales, dish-specific sales, forecasting, purchasing, and full P&L tracking. Crucially, we introduced specialized operational dashboards, including inventory loss and food waste analytics, as well as dynamic menu availability monitoring to track the exact uptime and downtime of specific dishes across all locations.
This phase transformed raw data into decision-ready Business Intelligence. By having dynamic visibility into highly specific metrics like dish availability and food waste, the iLunch management team gained the immediate ability to optimize daily operations, react to inefficiencies on the spot, and proactively drive profitability rather than just reviewing past performance.
- Phase IV: Automated reporting rollout and distribution
Beyond the interactive Power BI dashboards, we also implemented automated reporting for structured Excel files generated directly from the SQL database. This ensured that daily summaries and a variety of standardized Excel reports were automatically distributed to administrators and franchisees.
This final phase focused on operational sustainability and end-user adoption. By completely replacing the old, manual data-gathering process, we saved the administrative team hours of repetitive work each week. It created a reliable, scalable operational rhythm, giving franchise owners consistent and accurate daily insights to manage their individual locations effectively.
- Phase V: Ongoing support and data process expansion
To ensure the analytics architecture scales alongside iLunch’s growth, we provide long-term data engineering and maintenance.
Our ongoing partnership includes:
- Continuous Power BI support and proactive system optimization.
- On-demand development of new views, KPIs, and tailored dashboards.
- Data model upgrades to seamlessly integrate new operational requirements.
This ensures their Business Intelligence environment remains a dynamic, future-proof asset rather than a static reporting tool.
Results & Impact:
We delivered a comprehensive Business Intelligence and data warehouse solution that successfully transitioned iLunch from manual, Excel-heavy reporting to a fully automated and transparent analytics ecosystem. The new Power BI dashboards established a single source of truth, unifying fragmented data into clear, actionable views. By automating the entire data lifecycle, we eliminated hours of repetitive manual work for the administrative team. Today, iLunch management and franchisees benefit from comprehensive visibility into financial KPIs, forecasting, inventory loss, and dynamic menu availability, empowering them to make faster, data-driven decisions that drive profitability across all 40+ locations.
Key Takeaways:
Replacing manual data consolidation with automated data pipelines is often the difference between static reporting and real-time, decision-ready analytics. For fast-paced, multi-location food businesses, establishing a centralized data architecture creates a much stronger foundation for timely performance management and operational efficiency.
The project also shows the value of combining POS, ERP, and operational data into one analytical model. When a business can track financial KPIs, forecasting, inventory loss, and dynamic menu availability in the same environment, it gains a much clearer understanding of what is driving profitability and a highly scalable base for future reporting growth.