Public Sector Data Transformation: Building an Automated Regional Intelligence Platform with Power BI
Client
Employment Service of Lithuania (Užimtumo tarnyba)Client Overview:
The Employment Service of Lithuania (UŽT) is responsible for implementing national labor market policies and providing employment services across the country. To support initiatives encouraging Lithuanian citizens living abroad to return and settle in Lithuania, the organization needed a centralized digital platform – the Lithuanian Regional Map. This online platform provides detailed information about different Lithuanian regions including key indicators and insights on housing, employment opportunities and education to help users better understand local conditions.
The Challenge:
Prior to the project, data relevant for regional analysis was distributed across multiple institutions and information systems, including public statistics databases, labor market datasets, salary benchmarks, and job vacancy sources. The fragmented nature of these datasets made it difficult to access consistent, comparable, and up-to-date regional indicators.
The Employment Service required a scalable data integration solution capable of combining heterogeneous data sources into a unified analytical model. Key requirements included automated ETL pipelines, standardized regional indicators, and an intuitive business intelligence interface allowing users to explore regional trends across labor market, housing, education, and macroeconomic dimensions.
Our Approach:
- Phase I: Concept design and data model definition
The project began with defining the conceptual framework of the regional labor market intelligence platform and identifying key indicators relevant for diaspora users and regional policy analysis. Core thematic areas included employment, salaries, housing affordability, education availability, and macroeconomic trends.
During this phase, a standardized data model for regional indicators was designed, ensuring consistent definitions across municipalities and data sources. Reporting requirements, dashboard structure, and visualization logic were defined to support intuitive exploration of regional data and comparison of indicators across geographic areas.
- Phase IIA: Data integration and ETL automation
The data architecture focused on building automated data integration pipelines capable of extracting, transforming, and loading data from multiple external and internal data sources. ETL workflows were implemented using KNIME to integrate data from APIs, SQL databases, CSV files, Excel sources, and external public datasets.
The ETL pipelines standardized municipality identifiers, harmonized data formats, and transformed raw datasets into structured indicator tables stored in a centralized analytics database. Automated workflows deployed on a virtual machine enabled scheduled updates of regional indicators, reducing manual data preparation effort and ensuring continuously refreshed datasets.
- Phase IIB: Data preparation and indicator processing
Following data ingestion, transformation workflows prepared datasets for analytical use by cleaning, structuring, and enriching regional indicators. Data processing steps included normalization of geographic identifiers, calculation of derived metrics, alignment of municipality and regional classifications, and integration of multiple indicator dimensions required for reporting.
This processing layer enabled creation of a consistent analytical dataset covering labor market metrics, employer activity indicators, salary benchmarks, and job vacancy statistics across Lithuanian regions.
- Phase III: Power BI regional intelligence platform
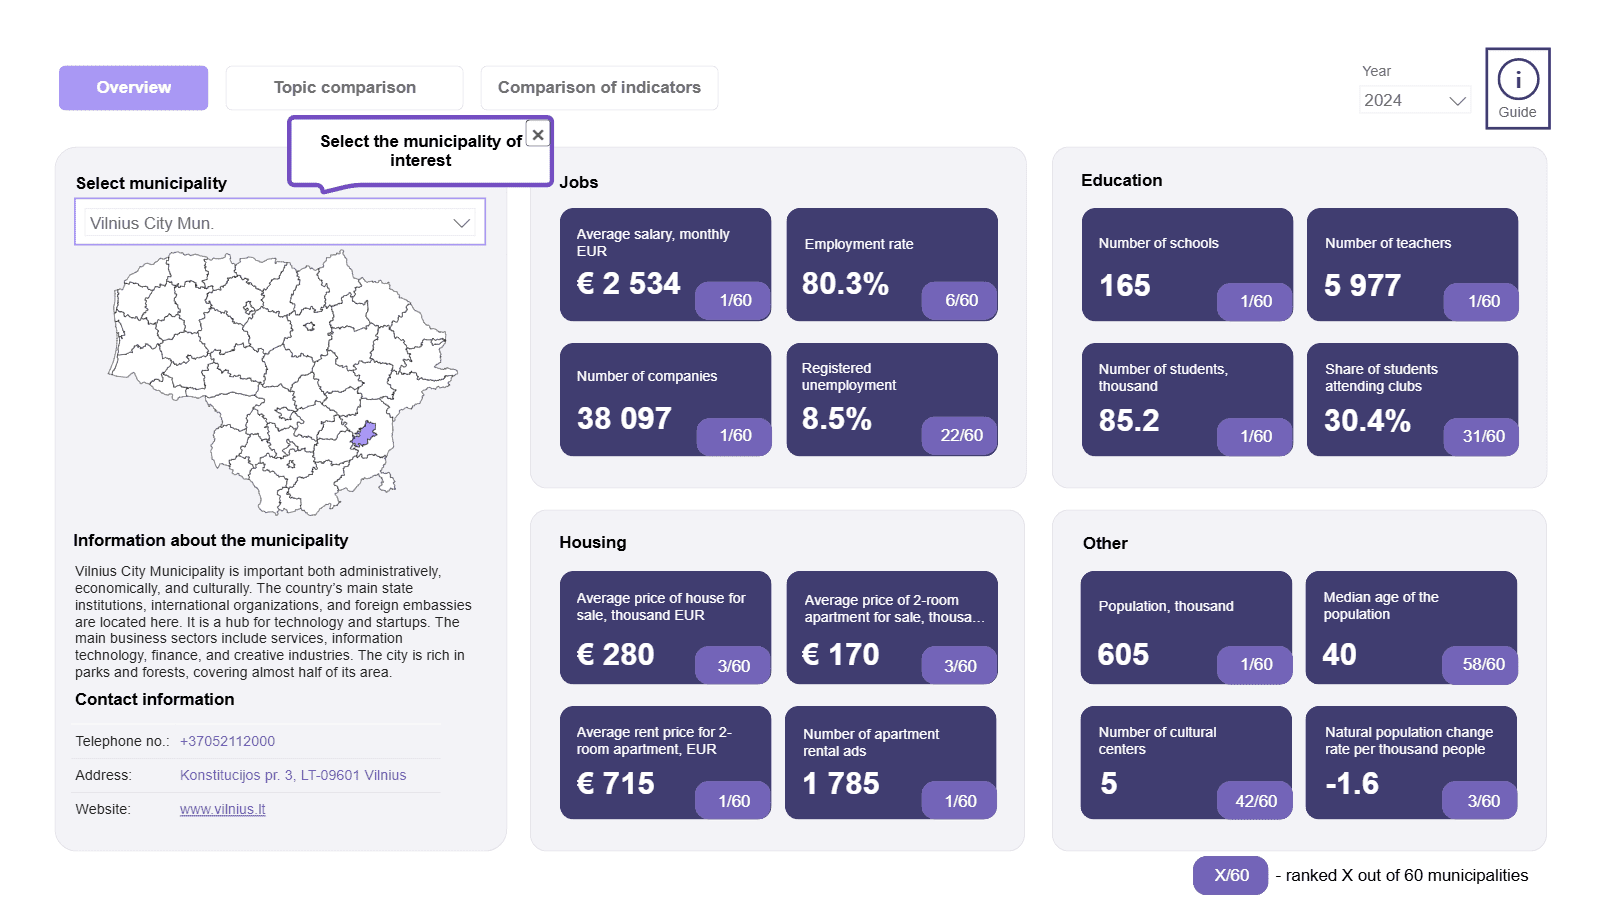
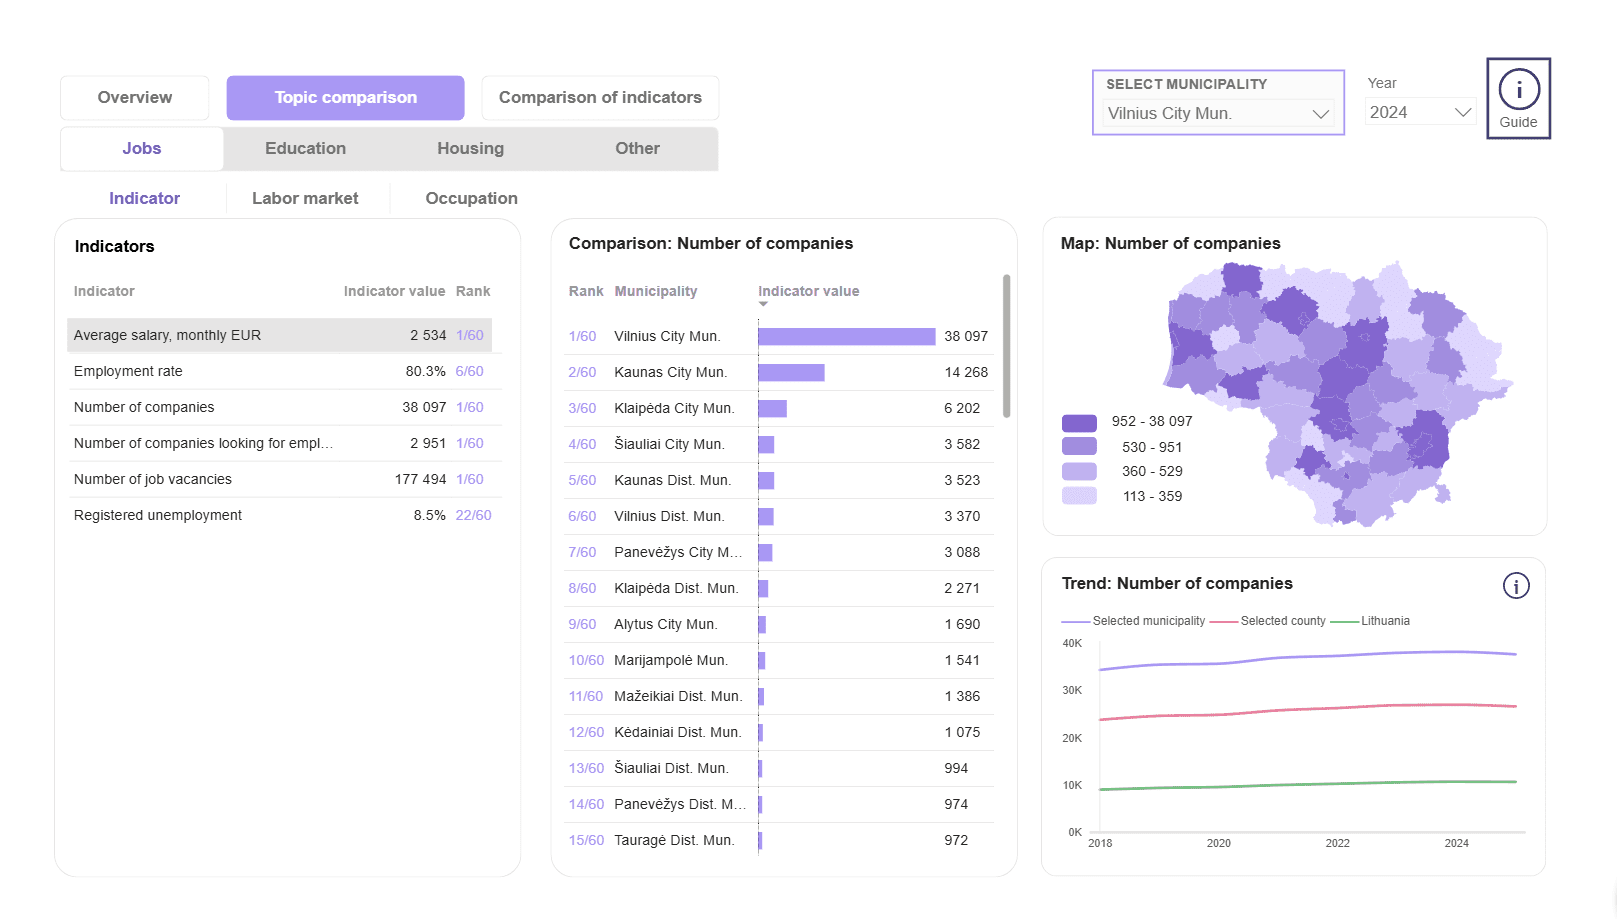
On top of the data infrastructure, an interactive Power BI analytics environment was developed and embedded into a web platform. The business intelligence solution provides multiple analytical views, including macro-level regional comparisons, labor market demand indicators, job vacancy analytics, salary insights, housing affordability metrics, and education availability indicators.
Users can dynamically filter municipalities, time periods, and indicator categories, enabling comparative regional analysis and visualization of historical trends. The interactive map interface supports intuitive exploration of geographic patterns while dashboards provide deeper analytical insights through charts, tables, and KPI visualizations.
- Phase IV: Deployment, integration, and user enablement
The final phase focused on deployment of the analytics platform and ensuring long-term operational sustainability. Activities included validation of ETL pipelines, testing of data accuracy, integration of Power BI dashboards into the web environment, and preparation of technical documentation describing data workflows and update procedures.
Training sessions were delivered to system administrators, enabling the Employment Service to independently maintain data pipelines, update indicators, and extend the analytics platform with additional datasets in the future.
Results & Impact:
The project resulted in a centralized regional analytics platform that integrates multiple public and institutional data sources into a unified business intelligence environment. The solution improves accessibility and transparency of regional labor market indicators by transforming fragmented datasets into structured analytical insights.
Automated ETL pipelines reduce manual data preparation effort and ensure regularly updated regional indicators, while the scalable data architecture allows future expansion of analytical capabilities and integration of additional datasets.
The interactive regional map enables users to evaluate employment opportunities, salary levels, housing conditions, and education availability across municipalities, supporting relocation decisions and regional policy planning. The platform demonstrates how data integration, ETL automation, and Power BI dashboard development can be combined to create scalable public sector analytics solutions.
The regional intelligence platform is available here: https://uzt.lt/en/map-of-lithuanias-regions/542
Key Takeaways:
This project demonstrates how fragmented public datasets can be transformed into a scalable analytics platform through structured data integration, automated ETL pipelines, and intuitive business intelligence dashboards.
By consolidating labor market, economic, housing, and education indicators into a centralized data environment, the Employment Service improved accessibility of regional information and enabled data-driven decision making for migration policy, regional planning, and workforce development initiatives.
The solution highlights the value of combining modern data engineering practices with interactive Power BI visualization tools to create decision-support platforms for public sector organizations.